Weekly Editorial: August 02, 2026
The week’s hidden structure was policy pressure being absorbed, not resolved. Prediction markets hardened around a no-easing Fed, far-end rates pressed higher, yet credit and volatility kept the equity surface orderly.… Inside this report: Bluf · The Take · Reality Gap Signals: This was not a week of clean risk-on. It was a week in which markets learned to breathe inside a tighter room. Polymarket (prediction…
Report Excerpt
The week’s hidden structure was policy pressure being absorbed, not resolved. Prediction markets hardened around a no-easing Fed, far-end rates pressed higher, yet credit and volatility kept the equity surface orderly. The floor held…
This was not a week of clean risk-on. It was a week in which markets learned to breathe inside a tighter room. Polymarket (prediction markets that price event odds with live capital) put zero Fed cuts this year at 89% and a September hike…
The decisive layer stays hidden.
Deeper chart context, tactical framing, and positioning notes stay hidden in the locked section.
That is not relief. It is a higher discount-rate ceiling with better shock absorbers. Equities were allowed to rebound because the transmission belt…
What the teaser already tells you
Compressed cues pulled directly from the report body.
This was not a week of clean risk-on. It was a week in which markets learned to breathe inside a tighter room. Polymarket (prediction markets that price event odds with live…
The understructure stayed constructive enough to prevent a broad liquidation read. VIX (near-term equity insurance priced through options) was near 16, HY OAS (extra yield risky…
The contradiction came from rates and FX. Equities behaved as if policy pressure was manageable, while yen-support headlines and far-end yield pressure said policymakers are…
Spy Vix
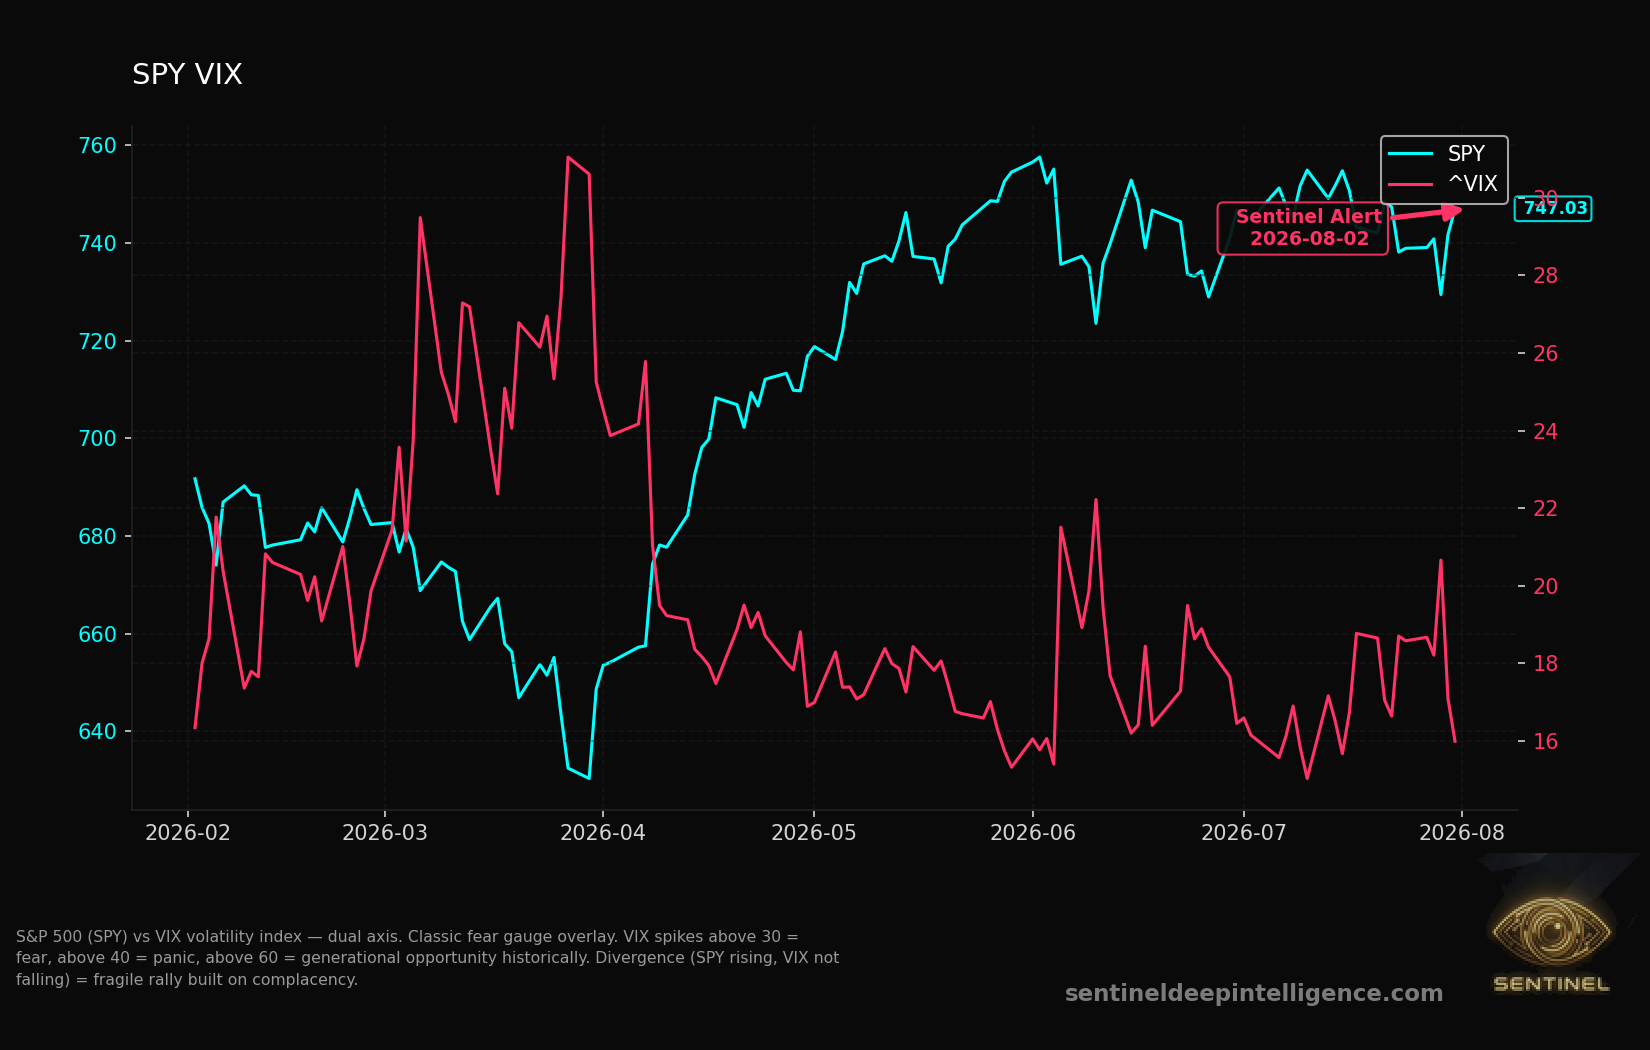
S&P 500 (SPY) vs VIX volatility index — dual axis. Classic fear gauge overlay. VIX spikes above 30 = fear, above 40 = panic, above 60 = generational opportunity historically. Divergence (SPY rising, VIX not falling) =…
Credit Stress
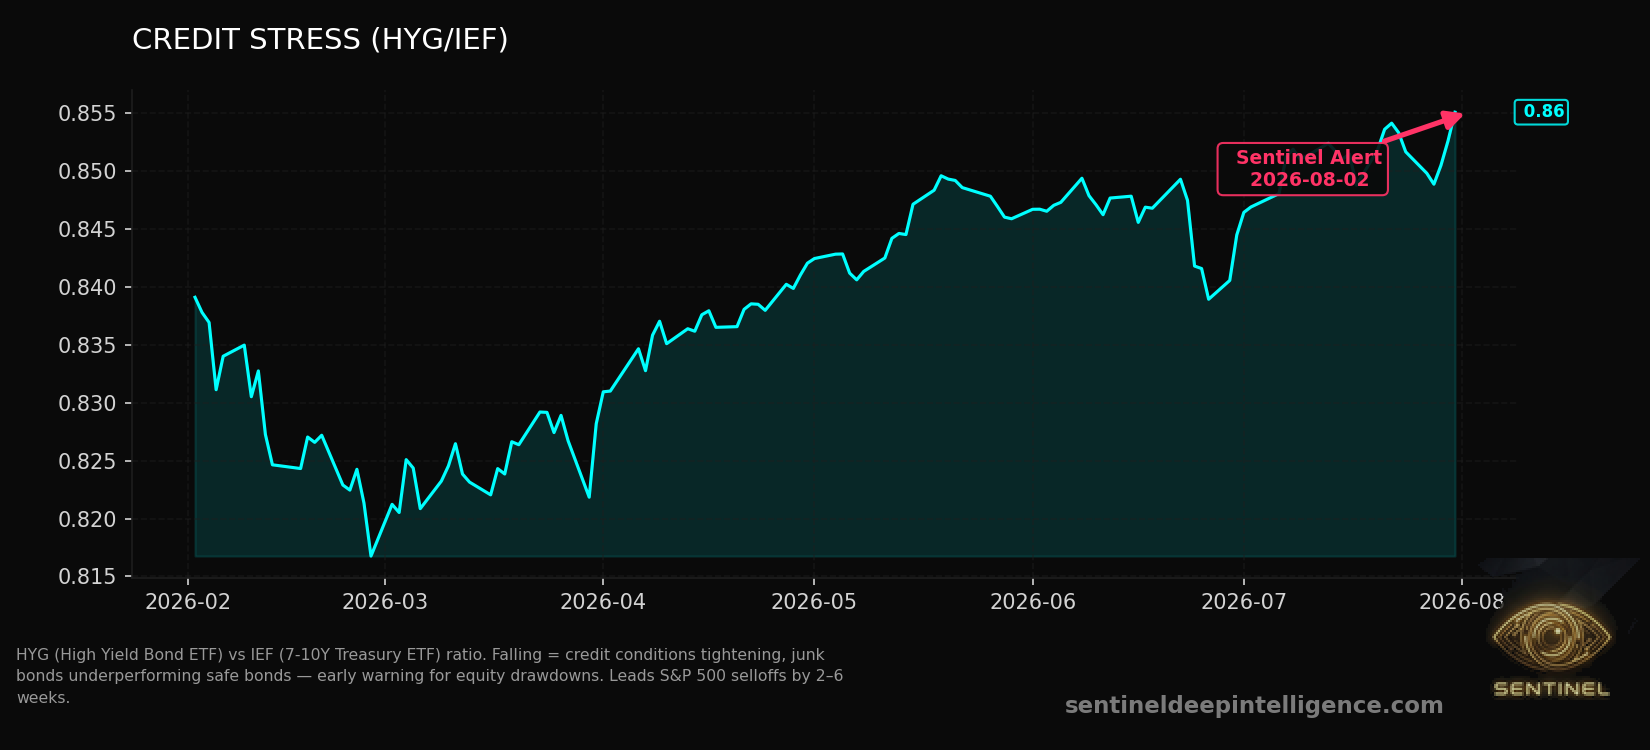
HYG (High Yield Bond ETF) vs IEF (7-10Y Treasury ETF) ratio. Falling = credit conditions tightening, junk bonds underperforming safe bonds — early warning for equity drawdowns. Leads S&P 500 selloffs by 2–6 weeks.
Bonds Vs Stocks
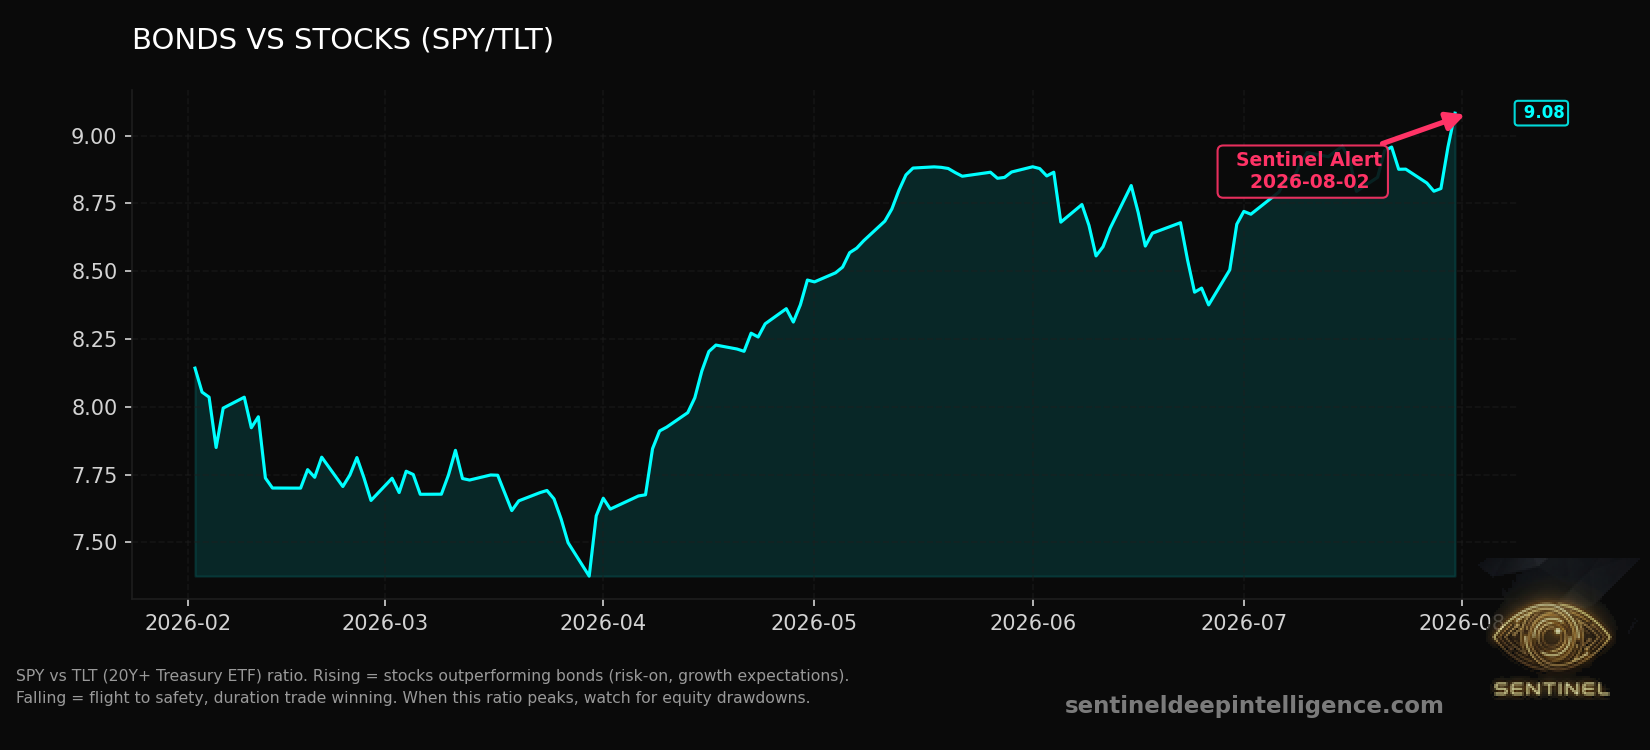
SPY vs TLT (20Y+ Treasury ETF) ratio. Rising = stocks outperforming bonds (risk-on, growth expectations). Falling = flight to safety, duration trade winning. When this ratio peaks, watch for equity drawdowns.
Bluf
The week’s hidden structure was policy pressure being absorbed, not resolved. Prediction markets hardened around a no-easing Fed, far-end rates pressed higher, yet credit and…
Deeper chart context, tactical framing, and positioning notes stay hidden in the locked section.
The Take
This was not a week of clean risk-on. It was a week in which markets learned to breathe inside a tighter room. Polymarket (prediction markets that price event odds with live…
That is not relief. It is a higher discount-rate ceiling with better shock absorbers. Equities were allowed to rebound because the transmission belt…
Reality Gap
Consensus saw a resilient equity tape and less oil panic. Market-implied odds said the rescue option is mostly gone. The gap is that investors may be treating “no crash” as “no…
A calm index with a higher borrowing cost is like a family budget where the mortgage resets upward but the grocery receipt still looks normal.…
Plumbing
The understructure stayed constructive enough to prevent a broad liquidation read. VIX (near-term equity insurance priced through options) was near 16, HY OAS (extra yield risky…
That stack says the market is hedged, not broken. The plumbing did not scream. It negotiated.