Weekly Editorial: June 14, 2026
The week looked like a peace dividend. The plumbing disagreed. Every surface signal — collapsing volatility, a positioning squeeze, the largest IPO in history — is being contradicted by the instruments that measure… Inside this report: Bluf · The Take · Reality Gap Signals: The week looked like a peace dividend. The plumbing disagreed. Every surface signal — collapsing volatility, a positioning squeeze, the largest…
Report Excerpt
The week looked like a peace dividend. The plumbing disagreed. Every surface signal — collapsing volatility, a positioning squeeze, the largest IPO in history — is being contradicted by the instruments that measure risk. This was not a…
Seven days ago the hidden structure was exhaustion: a dealer cushion that wore through while the load kept growing. This week the surface patched itself and the foundation did not. Volatility fell back below 18. Put buying evaporated.…
The decisive layer stays hidden.
Deeper chart context, tactical framing, and positioning notes stay hidden in the locked section.
Deeper chart context, tactical framing, and positioning notes stay hidden in the locked section.
What the teaser already tells you
Compressed cues pulled directly from the report body.
The week looked like a peace dividend. The plumbing disagreed. Every surface signal — collapsing volatility, a positioning squeeze, the largest IPO in history — is being…
The narrative is de-escalation: an Iran deal near signing, oil easing, risk appetite roaring back as the SpaceX IPO was oversubscribed to record levels. Prediction markets did…
One contradiction dominates: gold and silver are making new highs in the same week equities celebrated peace and volatility fell. Safe havens do not set records during a genuine…
Breadth
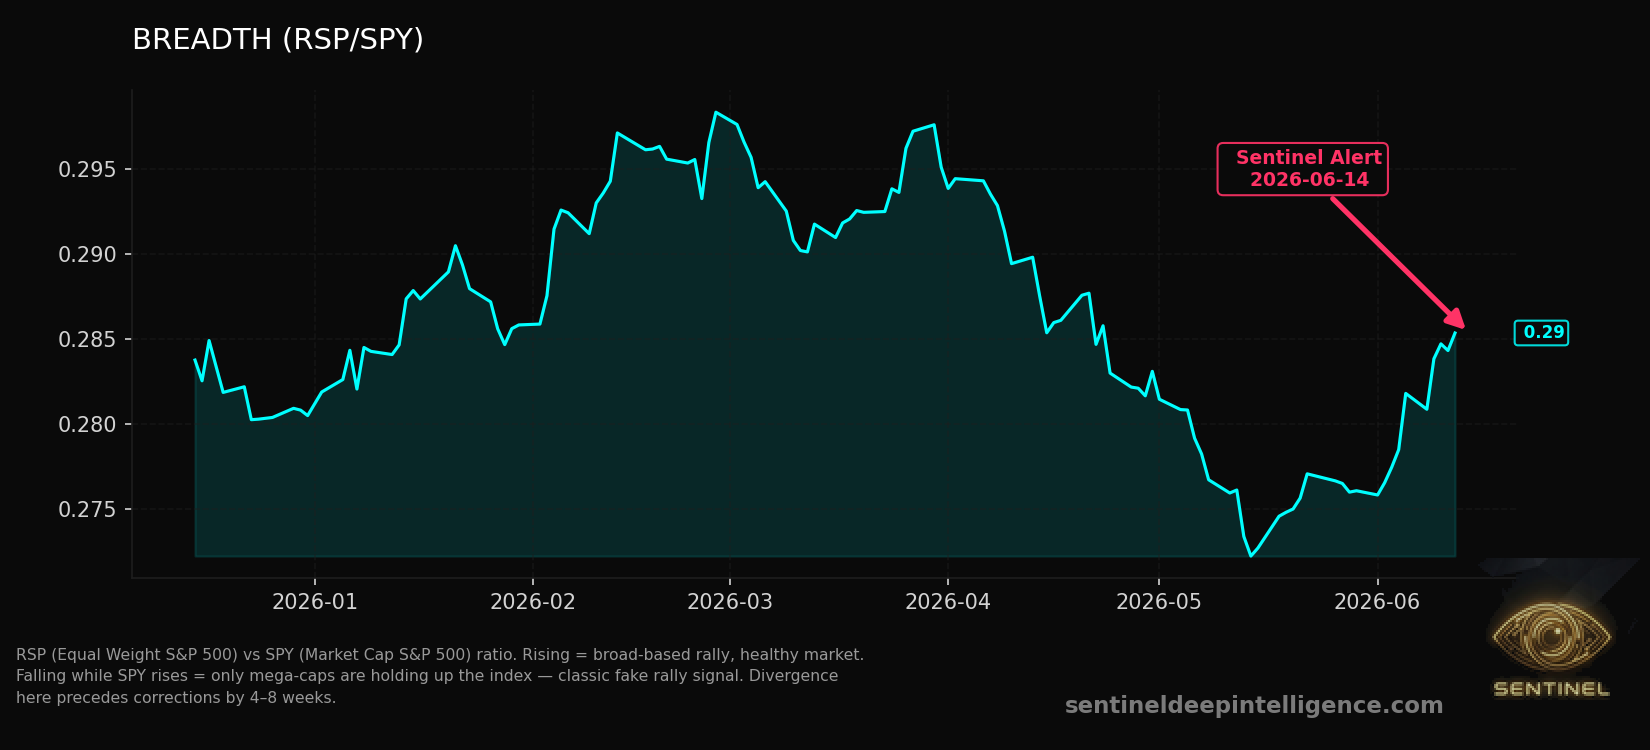
RSP (Equal Weight S&P 500) vs SPY (Market Cap S&P 500) ratio. Rising = broad-based rally, healthy market. Falling while SPY rises = only mega-caps are holding up the index — classic fake rally signal. Divergence here…
Credit Stress
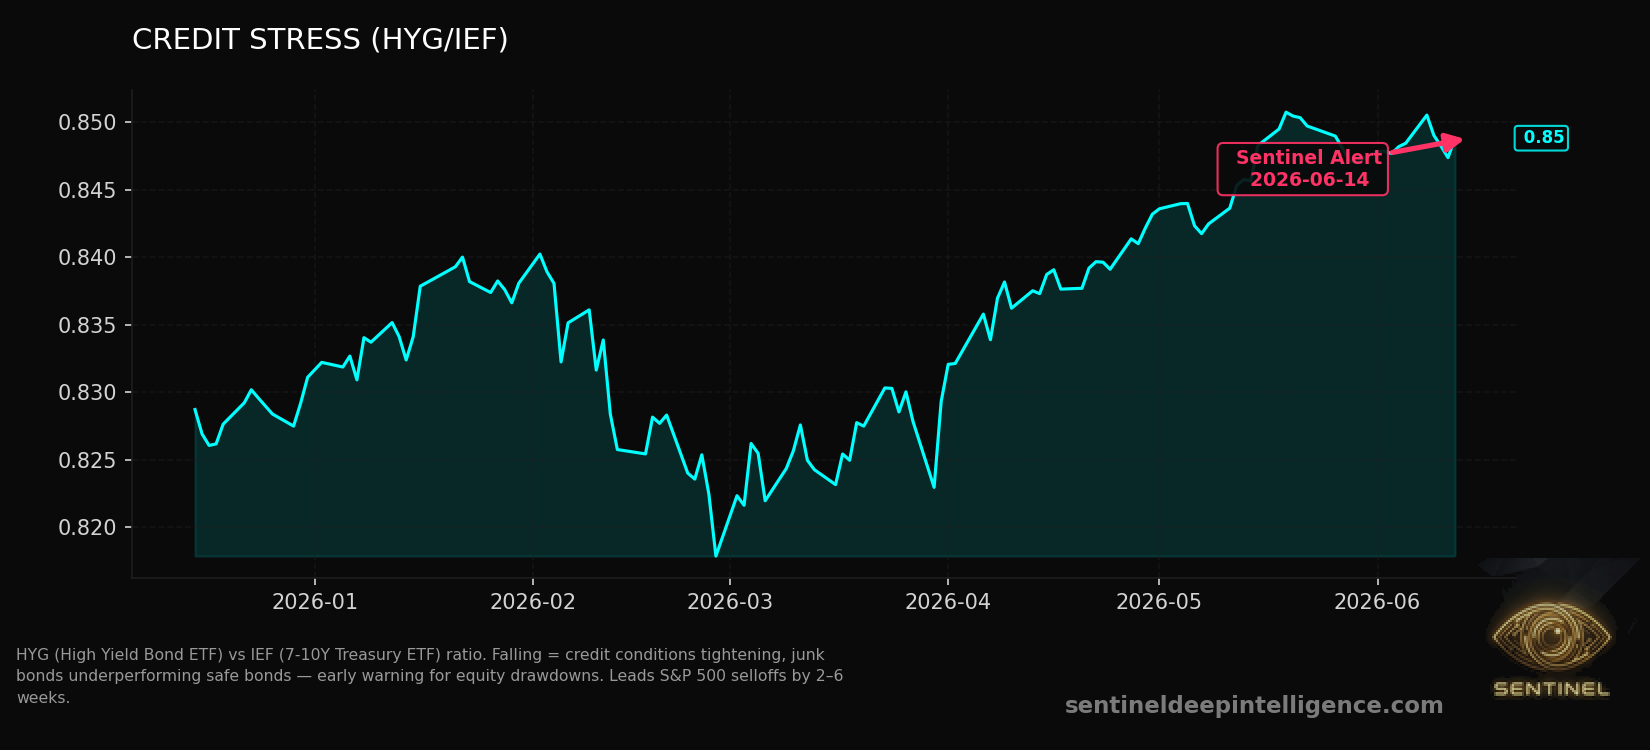
HYG (High Yield Bond ETF) vs IEF (7-10Y Treasury ETF) ratio. Falling = credit conditions tightening, junk bonds underperforming safe bonds — early warning for equity drawdowns. Leads S&P 500 selloffs by 2–6 weeks.
Gold Price
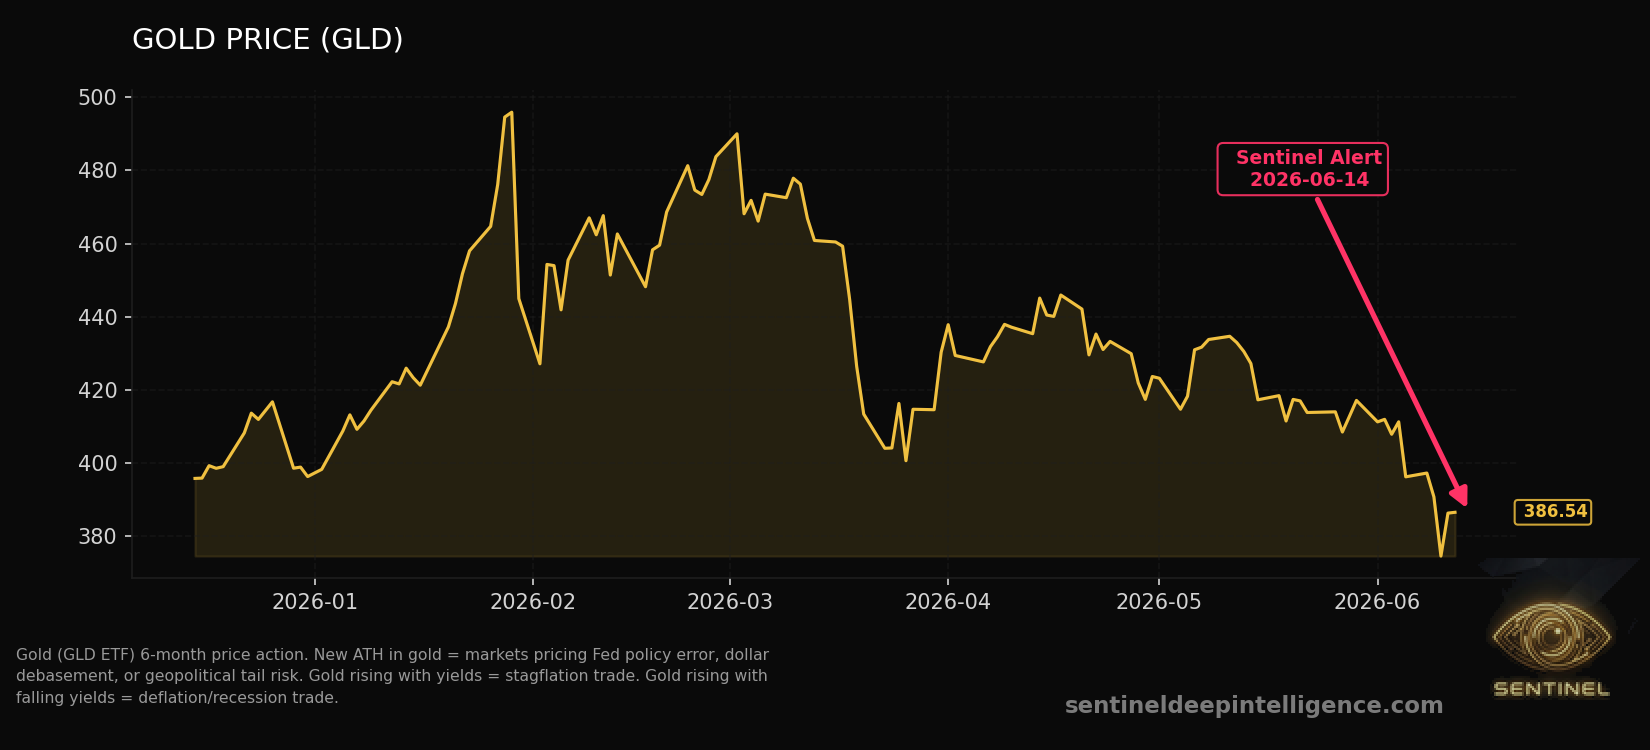
Gold (GLD ETF) 6-month price action. New ATH in gold = markets pricing Fed policy error, dollar debasement, or geopolitical tail risk. Gold rising with yields = stagflation trade. Gold rising with falling yields =…
Bluf
The week looked like a peace dividend. The plumbing disagreed. Every surface signal — collapsing volatility, a positioning squeeze, the largest IPO in history — is being…
Deeper chart context, tactical framing, and positioning notes stay hidden in the locked section.
The Take
Seven days ago the hidden structure was exhaustion: a dealer cushion that wore through while the load kept growing. This week the surface patched itself and the foundation did…
Deeper chart context, tactical framing, and positioning notes stay hidden in the locked section.
Reality Gap
The narrative is de-escalation: an Iran deal near signing, oil easing, risk appetite roaring back as the SpaceX IPO was oversubscribed to record levels. Prediction markets did…
Deeper chart context, tactical framing, and positioning notes stay hidden in the locked section.
Plumbing
Three cracks run beneath the relief. First, breadth has thinned to extreme lows — the rally rides on a handful of names while most of the tape refuses to confirm it. Second,…
Deeper chart context, tactical framing, and positioning notes stay hidden in the locked section.