📍 The One Thing That Matters Today
The market is not pricing panic. It is pricing controlled stress.
- S&P 500 sits near 7,775 🔻, only slightly lower, while Russell 2000 is down about 0.9% 🔻. Small caps are where high rates show up first.
- US 10Y yield is 5.29% 🔺. The stress line is 5.35%. Above that, rates stop being background noise and become the transmission channel.
- Crude is near $92.50 🔺 after tanker and Hormuz headlines. That is already above the usual inflation-comfort zone, but prediction markets still price only 10% odds of crude making an all-time high by December.
Narrative chart block
[Us10Y Yield]
[Us10Y Yield] synced from Sentinel's chart arsenal.
Narrative chart block
[Oil Price]
[Oil Price] synced from Sentinel's chart arsenal.
📉 Active Lens: The Fed Relief Gap
- SIGNAL: Policy relief is still not the market-implied base case.
- FACT: Polymarket, prediction markets where traders risk capital on outcomes, prices 96% odds of zero Fed cuts in 2026 on about $54M volume. December hike odds sit at 76% 🔺.
- FACT: Put/Call Ratio, downside insurance versus upside bets, is 1.37 🔺. Normal calm tapes often sit closer to 0.7-1.0. Above 1.2 means investors are paying up for protection.
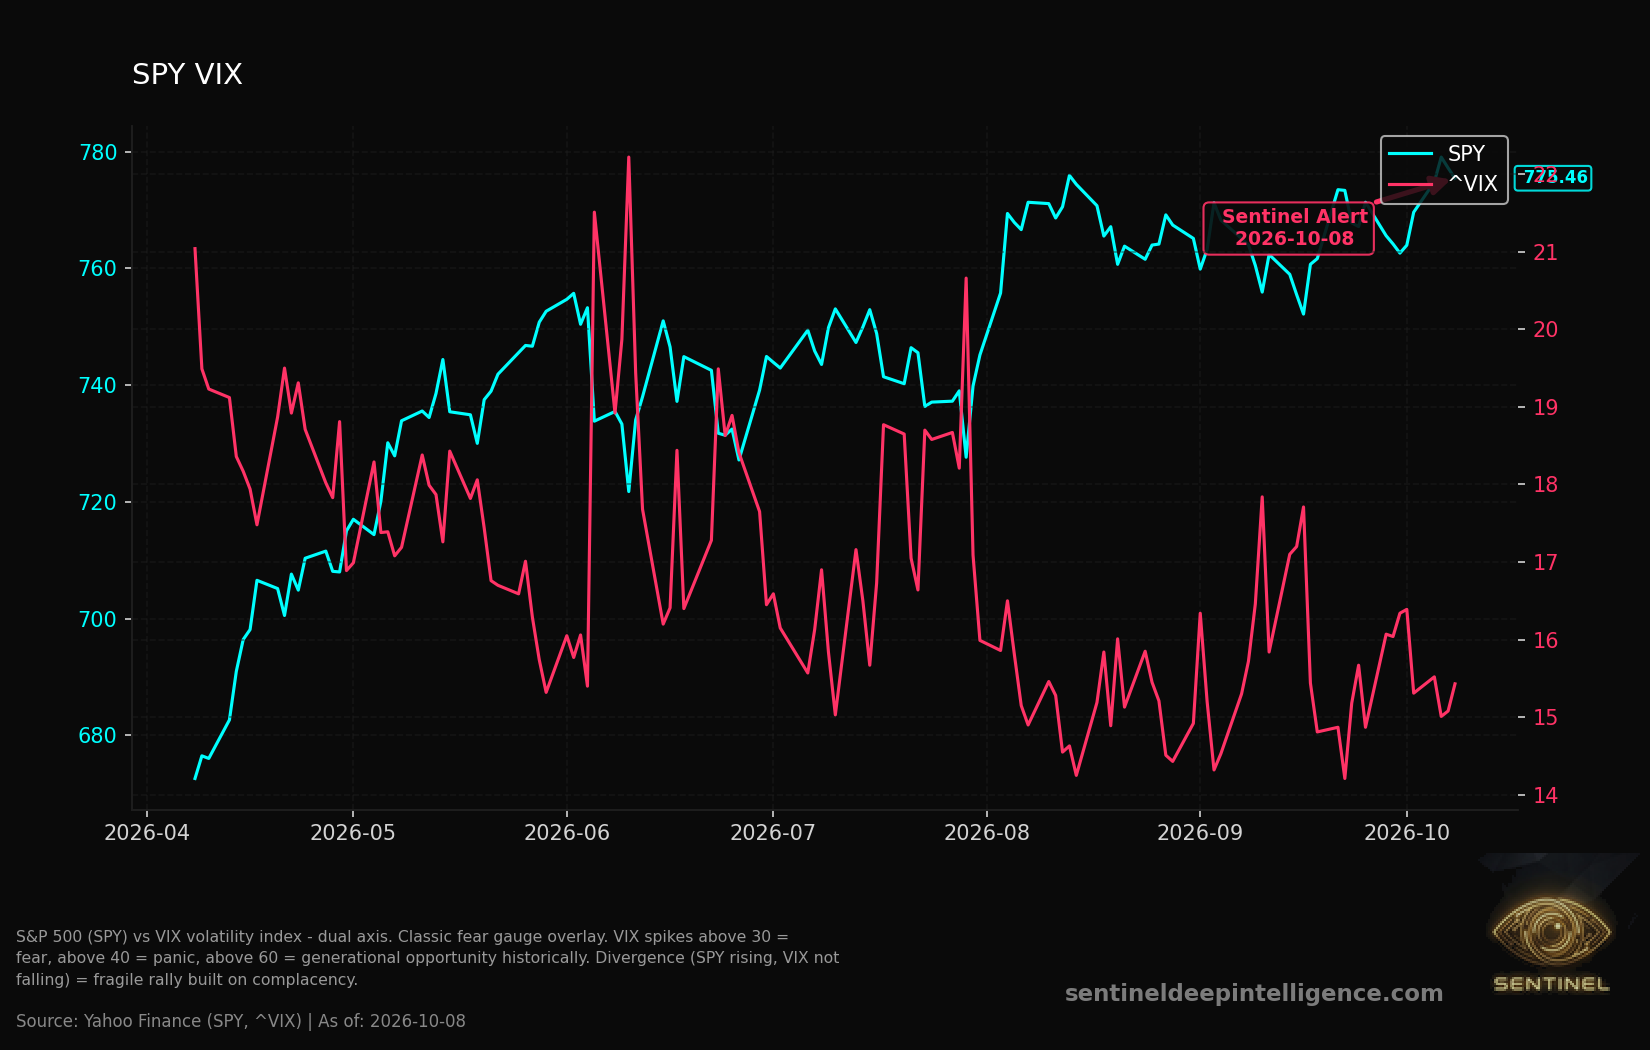
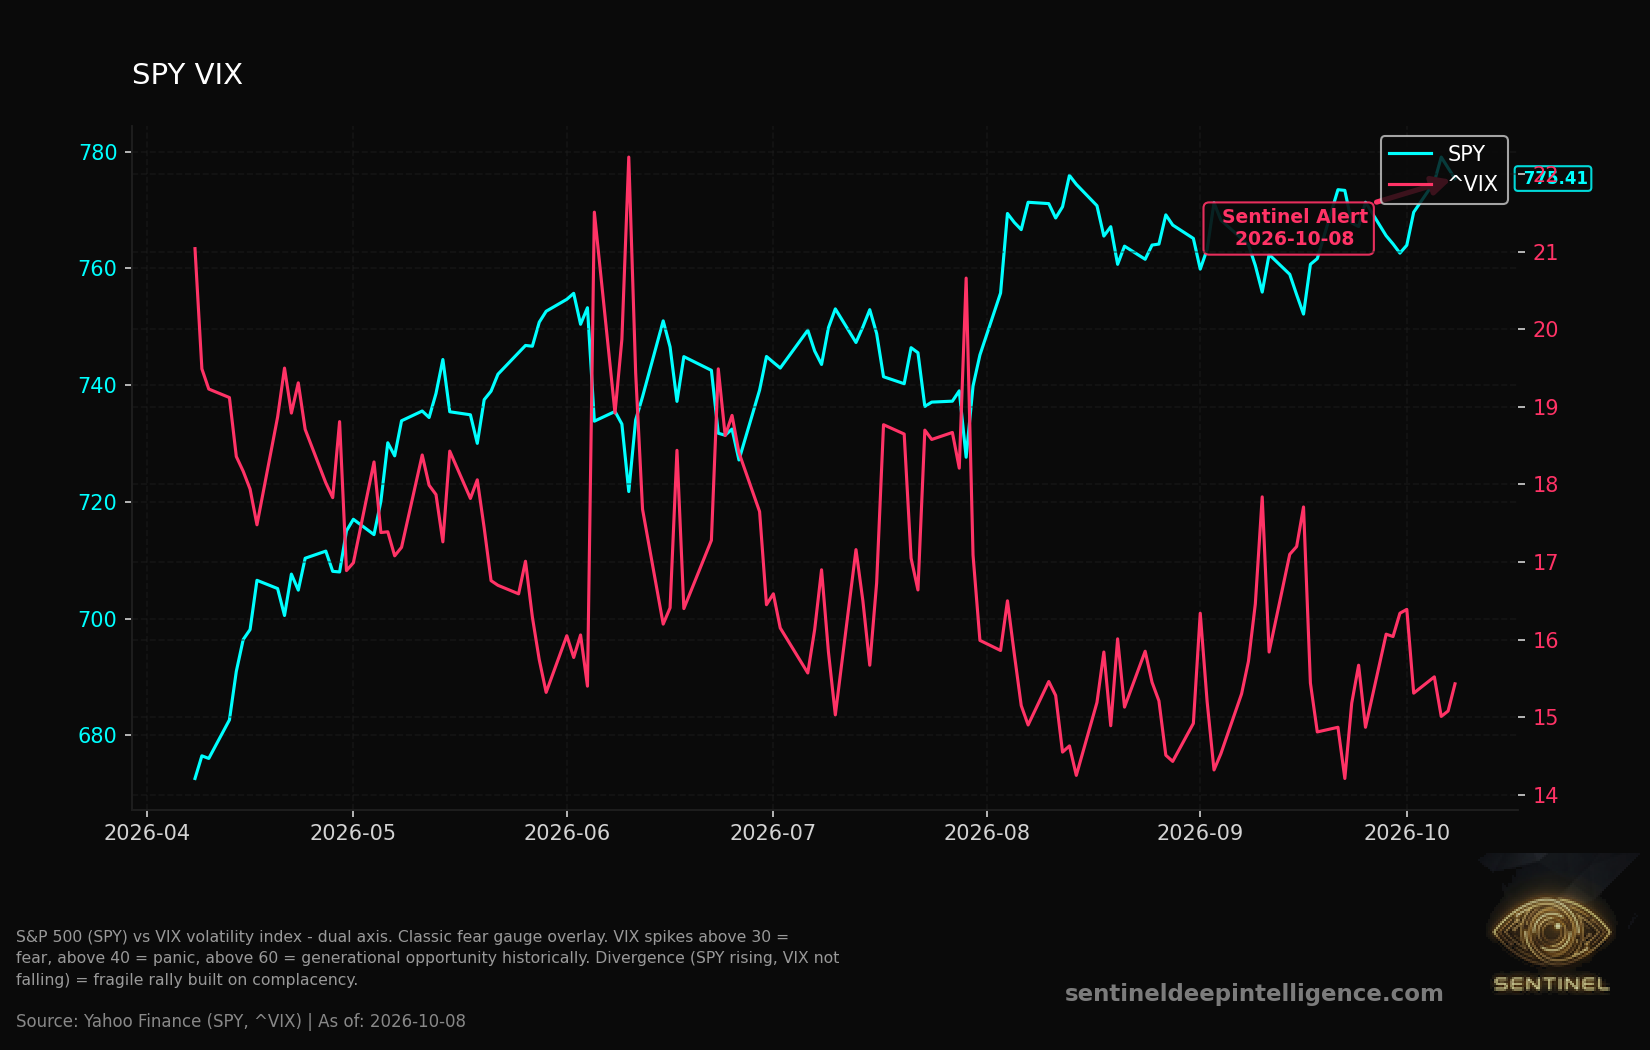
- FACT: VIX, the S&P 500 fear gauge, is still near 15 🔻. Normal is roughly 15-20. Above 30 is fear. The index looks calm because the dashboard light is dim, not because the engine is cool.
- INTERPRETATION: The gap is simple: headlines still want a Fed rescue, but priced markets say restrictive policy remains the base case. If oil keeps pressure on inflation and the 10Y moves through 5.35%, the first damage usually appears in small caps, crypto beta, and rate-sensitive growth rather than in the headline index.
- CONFIDENCE: HIGH, because the Fed path signal is large, liquid, and stable across several markets. Since 2018, similar low-VIX plus rising-protection setups have more often resolved through rotation or drawdown than clean upside over the next 2-3 weeks.
🧭 Scenario Map: 5-15 Trading Days
- Base Case, 55%: VIX stays below 18 and 10Y remains below 5.35%. Result: controlled chop, sector rotation, small caps lag.
- Downside, 30%: 10Y holds above 5.35%, VIX closes above 20, or crude moves above $95. Result: downside can travel faster through rate-sensitive assets.
- Relief, 15%: 10Y falls below 5.10% and December hike odds drop below 50%. Result: growth and small caps can rebound, but only if policy pricing softens first.
👀 Watchlist
- US 10Y above 5.35%: rates become the equity stress path.
- Crude above $95: energy stops being a sector story and becomes a Fed story.
- December hike odds below 50%: the relief setup becomes more credible.
🔓 Unlock Full Briefing
Get the complete picture with dark pool data, GEX maps, and all 3 lenses.
Get the full Sentinel briefing