📊 Sentinel | May 7, 2026
🟡 CAUTIOUS | VIX 17.4 🔺 (52nd pct) | Stock F&G: 69 — Greed | Crypto F&G: 47
📉 The Half Market
The Financial Times put it plainly this morning: "Wall Street rebound driven by smallest number of stocks on record." The data confirms every word.
SPX sits at 7,343 and Nasdaq at 28,547, both near multi-month highs. But only 51% of S&P 500 components trade above their 200-day moving average 🔻. In every healthy bull market, that number runs 65-75%+. Right now, roughly half the index is still in a longer-term downtrend. The index number in the headline is the marquee. The building behind it is half empty.
- SPX RSI: 72.9 🔺 (overbought zone starts at 70; mid-trend normal is 50-60)
- NDX RSI: 79 🔺 (historically fragile territory, 90th+ pct over 52 weeks)
- Breadth: 51% above 200d MA 🔻 (healthy: 65%+; stress threshold: below 40%)
- CAPE valuation: 41.83 🔺 (long-run average near 17; current reading in 95th+ pct)
- Options dealer hedging load: $8.49B 🔺, absorbing volatility and pinning VIX at 17.4
Four to five mega-caps are doing all the lifting. The other 49% of the market never confirmed the rally. The $8.49B in dealer hedging obligations acts like pressure insulation on a boiler: it doesn't lower the pressure, it just keeps the gauge from moving until it can't.
Real-money prediction markets price only a 26% chance of an Iran peace deal. Oil at $94 is not pricing one either. The commodity most directly exposed to a Hormuz resolution is still carrying a conflict premium. Equities are not.
The last four times S&P breadth fell below 52% while SPX RSI exceeded 70, narrow leadership resolved in a 5-15% drawdown within 60 days in 3 of 4 instances (75%). The exception required a genuine new macro catalyst to sustain the advance. That catalyst currently sits at 26% odds on the most liquid prediction market in the world.
Premium coverage goes deeper: full Polymarket vs. equity divergence analysis, dark pool accumulation signals, insider cluster mapping, and scenario probabilities with precise levels. Daily.
Spy Rsp Breadth
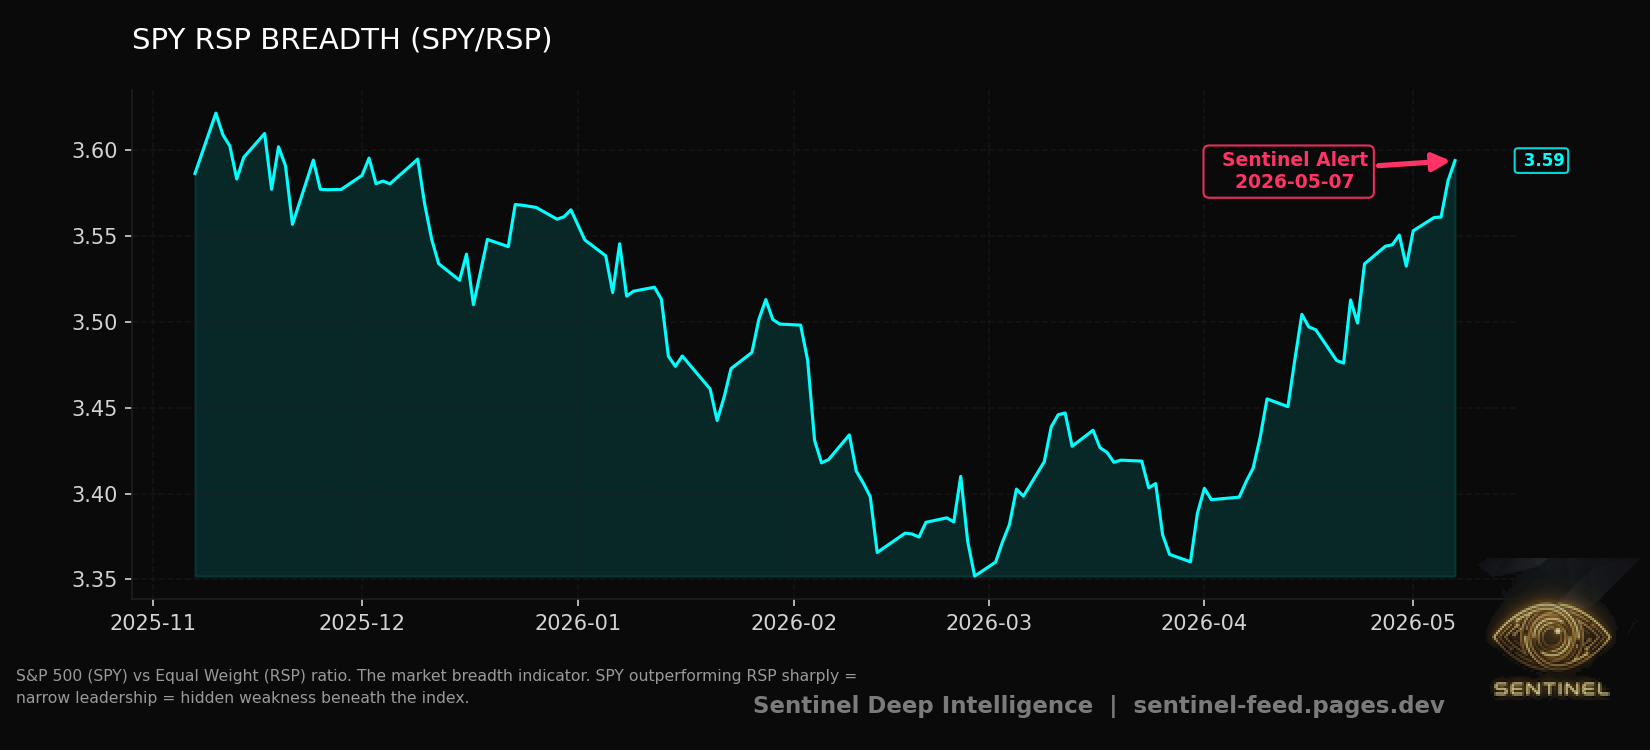
S&P 500 (SPY) vs Equal Weight (RSP) ratio. The market breadth indicator. SPY outperforming RSP sharply = narrow leadership = hidden weakness beneath the index.
Oil Price
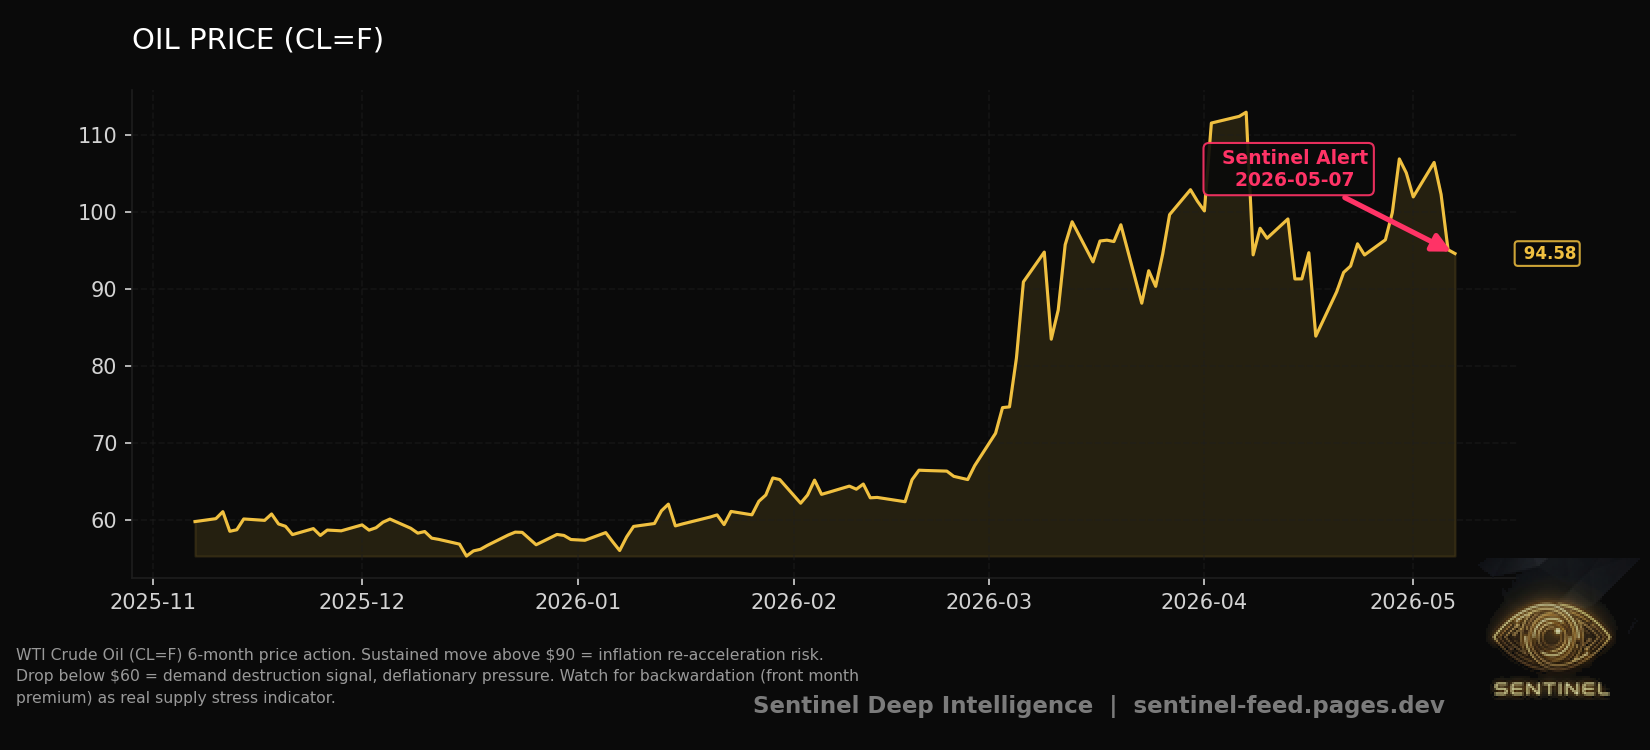
WTI Crude Oil (CL=F) 6-month price action. Sustained move above $90 = inflation re-acceleration risk. Drop below $60 = demand destruction signal, deflationary pressure. Watch for backwardation (front month premium) as…